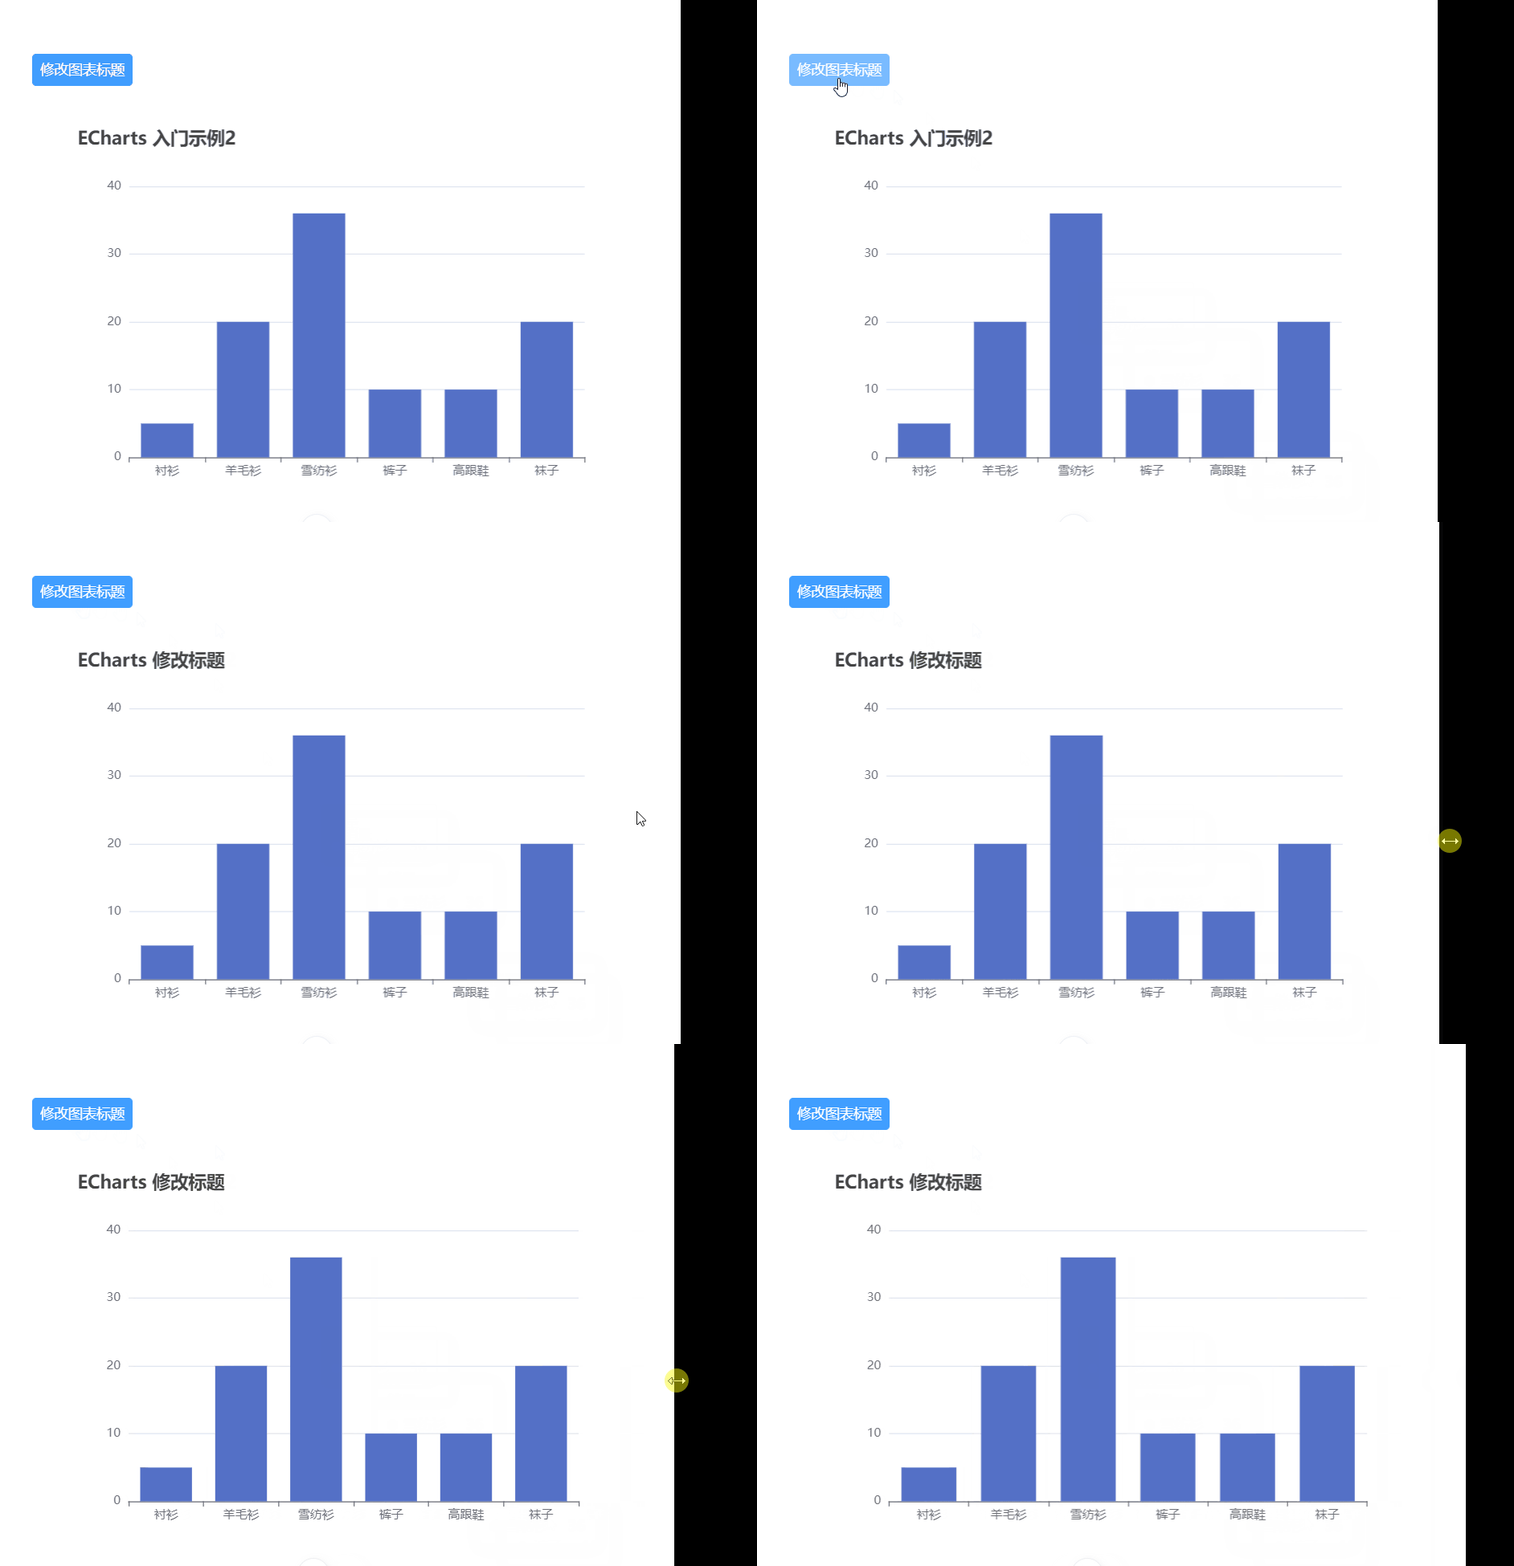
效果预览

技术方案
vue3 ( vite | TS | AutoImport ) + Element Plus + UnoCSS + ECharts
技术要点
ECharts 实例的类型
let myChart: echarts.ECharts | null = null
默认生成随机 id
id: {type: String,default: () => Math.random().toString(36).substring(2, 8)},
深度监听图表配置的改变
watch(props.option,() => {if (myChart) {myChart.setOption(props.option)}},{ deep: true }
)
挂载页面后,再创建图表实例
onMounted(() => {// 基于准备好的dom,初始化echarts实例myChart = echarts.init(document.getElementById(props.id))// 绘制图表myChart.setOption(props.option)if (props.autoResize) {window.addEventListener('resize', () => {myChart?.resize()})}
})
销毁页面时,销毁图表实例
onUnmounted(() => {if (props.autoResize) {window.removeEventListener('resize', () => {myChart?.resize()})}myChart?.dispose()
})
代码实现
安装依赖
npm install echarts --save
src/components/Chart.vue
<script setup lang="ts">
import * as echarts from 'echarts'const props = defineProps({option: {type: Object,default: () => ({})},id: {type: String,default: () => Math.random().toString(36).substring(2, 8)},width: {type: String,default: '100%'},height: {type: String,default: '350px'},autoResize: {type: Boolean,default: true}
})let myChart: echarts.ECharts | null = nullonMounted(() => {// 基于准备好的dom,初始化echarts实例myChart = echarts.init(document.getElementById(props.id))// 绘制图表myChart.setOption(props.option)if (props.autoResize) {window.addEventListener('resize', () => {myChart?.resize()})}
})watch(props.option,() => {if (myChart) {myChart.setOption(props.option)}},{ deep: true }
)onUnmounted(() => {if (props.autoResize) {window.removeEventListener('resize', () => {myChart?.resize()})}myChart?.dispose()
})
</script><template><div :style="{ width: width, height: height }" :id="props.id"></div>
</template>
页面使用
<script setup lang="ts">
let ChartConfig = reactive({title: {text: 'ECharts 入门示例2'},tooltip: {},xAxis: {data: ['衬衫', '羊毛衫', '雪纺衫', '裤子', '高跟鞋', '袜子']},yAxis: {},series: [{name: '销量',type: 'bar',data: [5, 20, 36, 10, 10, 20]}]
})
function changeChartTitle() {ChartConfig.title.text = 'ECharts 修改标题'
}
</script><template><div class="p-20"><el-button class="w-100px" type="primary" @click="changeChartTitle">修改图表标题</el-button><Chart class="m-10" height="400px" :option="ChartConfig" /></div>
</template>
