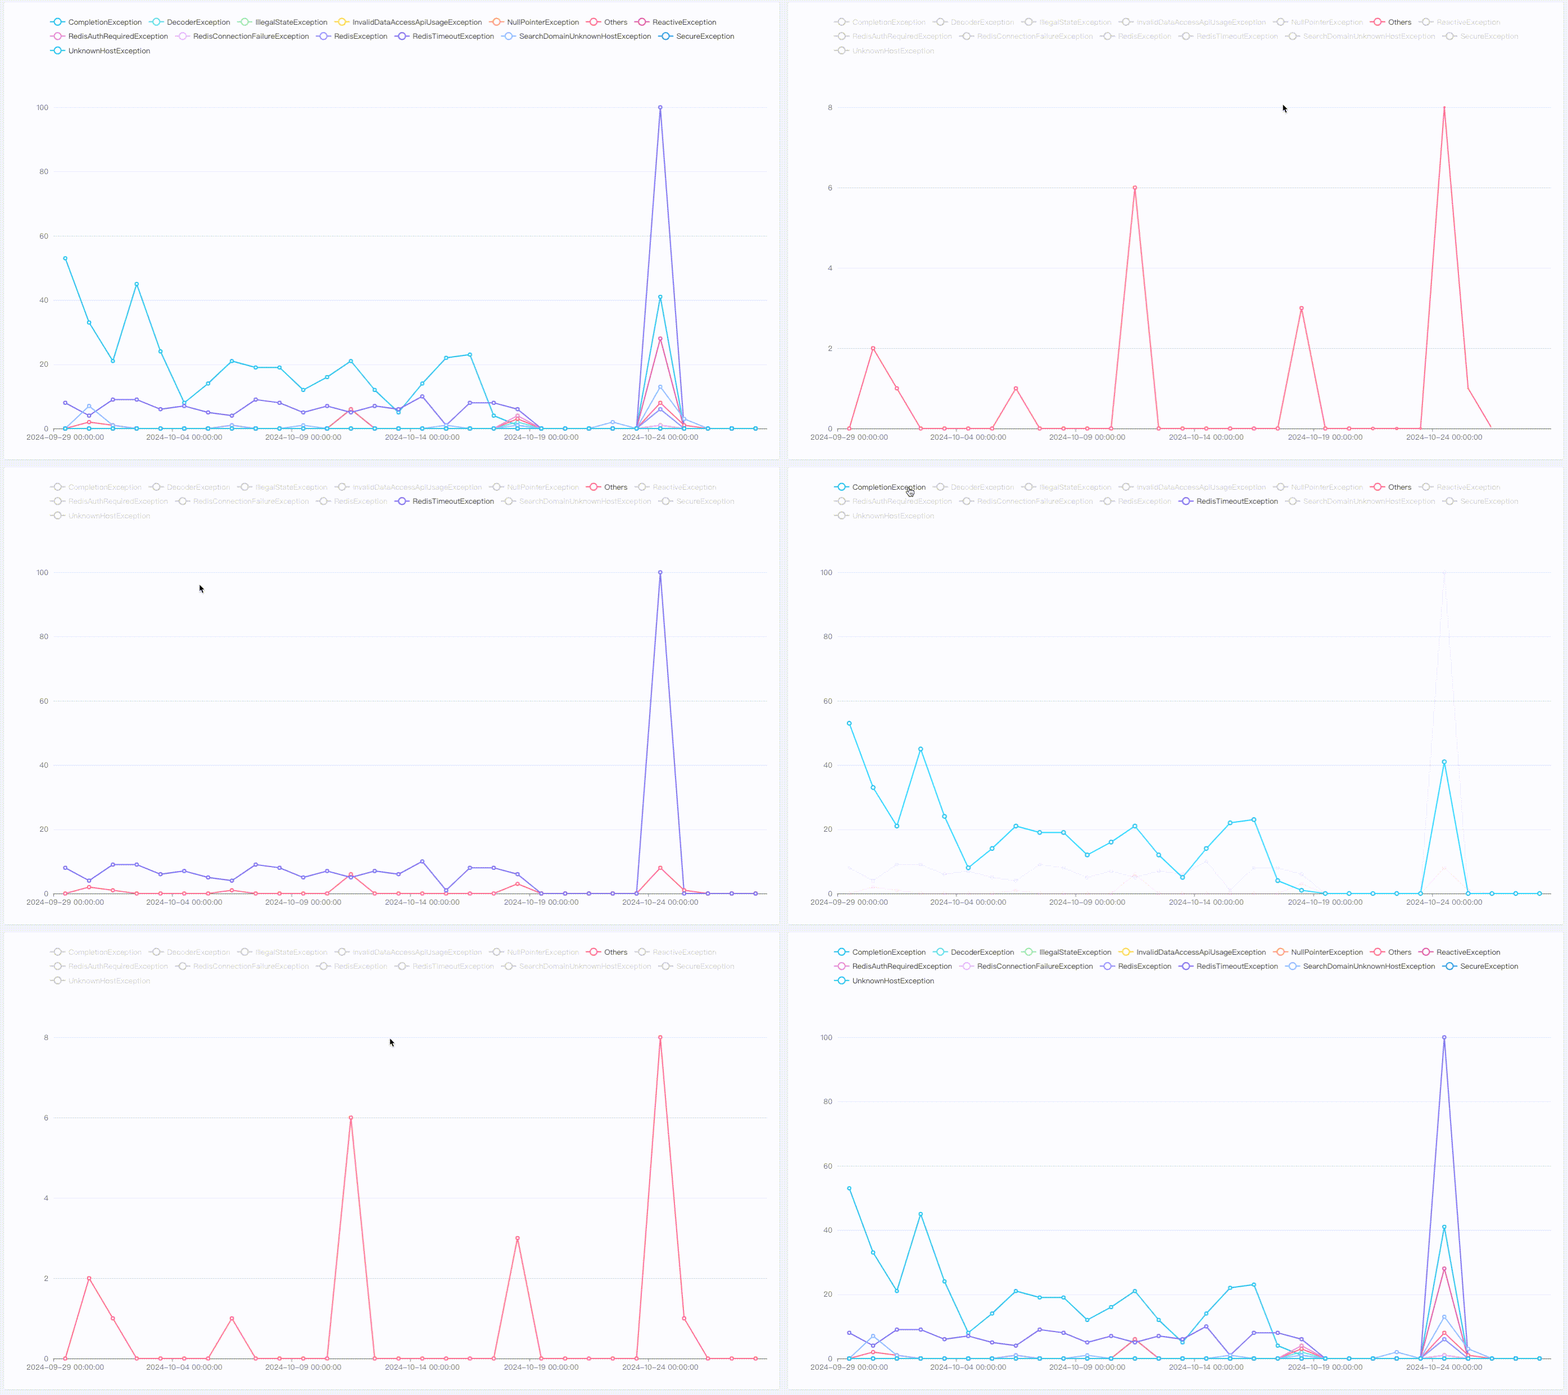
// 初始化图表
var myChart = echarts.init(document.getElementById('main'));// 配置项和数据
var option = {title: {text: '点击图例控制折线图展示示例'},tooltip: {trigger: 'axis',axisPointer: {type: 'line' // 使用 line 类型的 axisPointer 辅助}},legend: {data: ['折线1', '折线2', '折线3'],selectedMode: false // 禁用默认图例点击模式},xAxis: {type: 'category',data: ['周一', '周二', '周三', '周四', '周五', '周六', '周日']},yAxis: {type: 'value'},series: [{name: '折线1',type: 'line',data: [120, 132, 101, 134, 90, 230, 210]},{name: '折线2',type: 'line',data: [220, 182, 191, 234, 290, 330, 310]},{name: '折线3',type: 'line',data: [150, 232, 201, 154, 190, 330, 410]}]
};// 显示图表
myChart.setOption(option);// 存储当前显示的折线名称
let displayedLines = [];// 监听 legendselectchanged 事件
myChart.on('legendselectchanged', function (params) {const clickedName = params.name;if (displayedLines.includes(clickedName)) {// 情况 1:点击已展示的图例 -> 隐藏该折线图displayedLines = displayedLines.filter(name => name !== clickedName);} else {// 情况 2:点击未展示的图例displayedLines.push(clickedName);}// 更新图例的显示状态option.legend.data.forEach(name => {const shouldDisplay = displayedLines.length === 0 || displayedLines.includes(name);myChart.dispatchAction({type: shouldDisplay ? 'legendSelect' : 'legendUnSelect',name: name});});// 检查是否需要恢复所有图例的显示if (displayedLines.length === 0) {// 如果没有折线被选中,恢复所有折线的显示option.legend.data.forEach(name => {myChart.dispatchAction({type: 'legendSelect',name: name});});}
});
如果legendselectchanged不生效,把selectedMode: false注释掉再试试!
